A map of one diamond
Two SI2 diamonds can share the same grade, the same weight and the same color. You can still tell them apart in seconds. Turn to the clarity plot. Each full Diamond Grading Report carries a small drawing of the stone. It marks every significant inclusion and blemish where it sits. No two stones have the same map.
That's why the clarity characteristics matter beyond the grade. Like birthmarks, they identify one particular diamond. And they help gemologists separate natural stones from synthetics and simulants.
What the plot shows
On a GIA Diamond Grading Report:
- The plotted diagram is an outline drawing of the stone's shape and cutting style.
- Symbols on it show each clarity characteristic: its type, its position and roughly its size.
- The key to symbols lists the kinds of characteristic that appear on the plot. A laser drill hole, for example, shows up there.
The clarity grade itself rests on what the plot records: the size, nature, number, position and relief of the characteristics, seen at 10x. Graders find each characteristic, and at least two of them grade independently. Then they draw the characteristics onto an outline that matches the stone's own shape and facets.
Why the Dossier has no plot
The Diamond Dossier grades the same four Cs but leaves out the plotted diagram. Instead it lists, in words, the most significant characteristics behind the clarity grade, up to four of them. It also carries the report number laser-inscribed on the girdle, so you can still identify the stone.
On an IGI report: the method is the same idea: clarity at 10x, judged on the visibility, size, number, location and nature of the characteristics. The gemologist works around the stone segment by segment (IGI calls it a wedge technique). The result is a map of the stone. It records what's there and helps to recognize the stone later.
Try it yourself
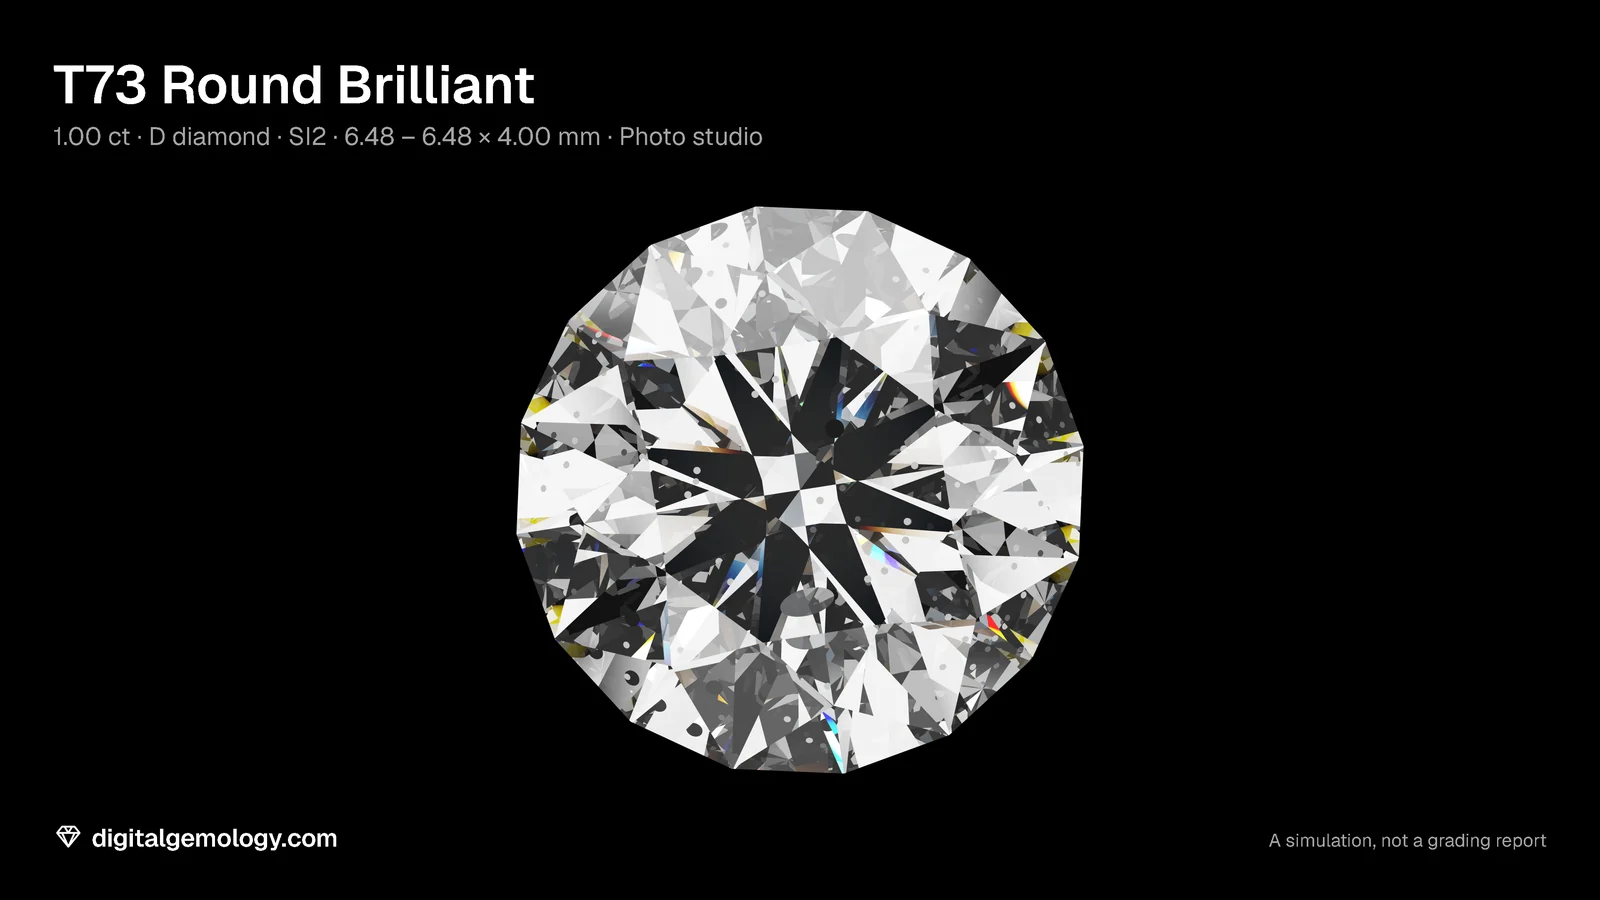
- Open 3D Gemstone Simulator, T73 in diamond, Photo studio, View face up. Set Clarity grade to SI2.
- Don't scroll down yet. Find every characteristic you can in the stone. Turn it a little to catch the ones that hide. Sketch a circle for the crown and mark where each one sits.
- Now scroll to Clarity characteristics in the report: crown on the left, pavilion on the right. Compare with your sketch. Then read the Comments line.
- Step the clarity to VVS1 and to I3, and watch the diagram fill and empty.
- Open PDF report: the plot is printed on the page, the way a lab report carries it.
What the simulator shows
The plot. At SI2 the simulator plots five characteristics: crystals, pinpoints and a feather. Each one is on the crown or pavilion view where it sits. Its Comments line lists their types. At VVS1 there's a single pinpoint; at I3, eight characteristics.
Your sketch. Most people find some, not all. A few sit under facets that only show them at an angle, and the small ones vanish in the pattern. That's why a grader examines the stone at 10x, from several sides, before plotting.
What the plot is for. It records the evidence for the grade, and it fingerprints the stone. Two stones with the same grade will still have different maps.
The simulator draws its plot from its own 3D model and its fixed set of characteristics per grade. It's a learning tool, not a lab plot.
Key points
- A full report's clarity plot shows each characteristic's type, position and approximate size on a diagram of the stone's shape.
- The key to symbols lists the kinds of characteristics shown. Treatments like laser drill holes appear there.
- The clarity grade rests on size, nature, number, position and relief at 10x.
- The Diamond Dossier has no plot. It lists up to four of the most significant characteristics in words and carries an inscription.
- A plot fingerprints a stone: two stones with the same grade have different maps.
Go further: each clarity grade, from Flawless to I3.
Try it free
- 3D Gemstone Simulator: Turn a cut in seven gemstones and set its carat, color, clarity and cut grade.
Free, in your browser, no account.
Quick quiz
Five questions on this lesson, a couple of minutes. Pick an answer and see at once if you got it, and why.
Cuts in this lesson
We sell the files of these cuts: 3D models and cutting files, with a personal-use license.
Keep exploring
- Next lesson: How to read the proportion diagram on a diamond report
- Try another topic · The four Cs of diamonds: Carat weight vs size: why a 2 ct diamond isn't twice as big
Previous lesson · How to read a diamond grading report: all lessons · All topics